Description
How to read it
The indicator is very easy to use as it gives us an accurate reading about the trend.
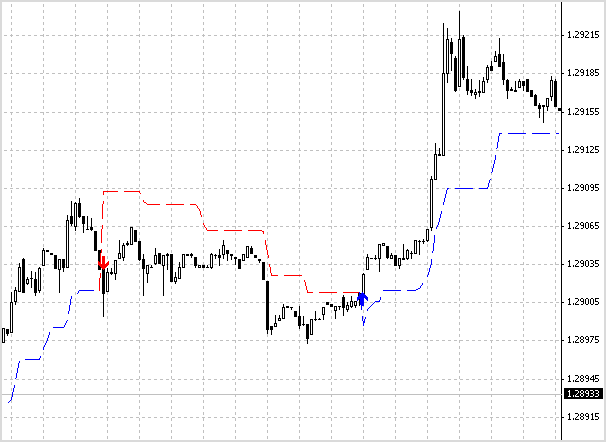
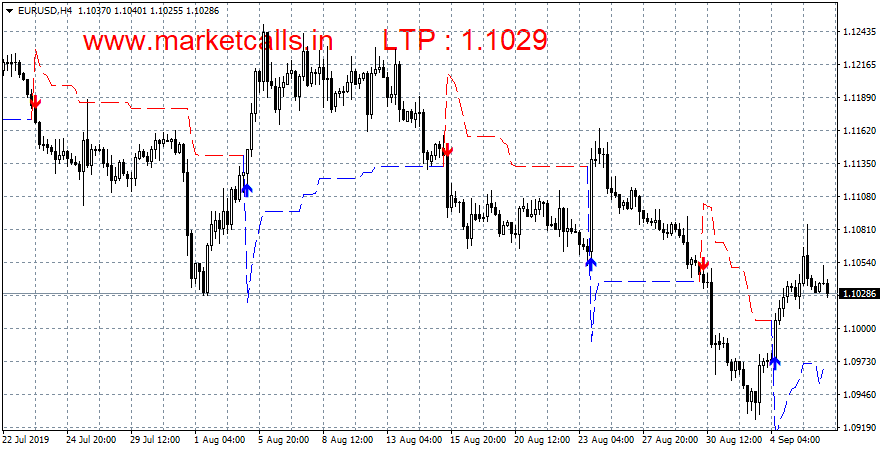
If the line is above the price bar and it is colored red, the trend is down. If the line is below the price bar and it is colored blue the trend is up.
The change of the trend is displayed by the arrows. When a trend becomes bullish a blue arrow pointing upwards is shown on the chart while when the trend becomes bearish a red arrow pointing down is be displayed.
How to use it
A Non-Repainting Supertrend Indicator For MT4 can be used in a wider range of markets: Forex, Commodities, Indices, and Stocks. It can be used daily, weekly and also hourly charts. The indicator can be used alone or in combination with other indicators (oscillators or pivot points). It is used for determining entry points and for defining stop-loss levels. Generally, it works well in a trending market but not so well in a sideways market.
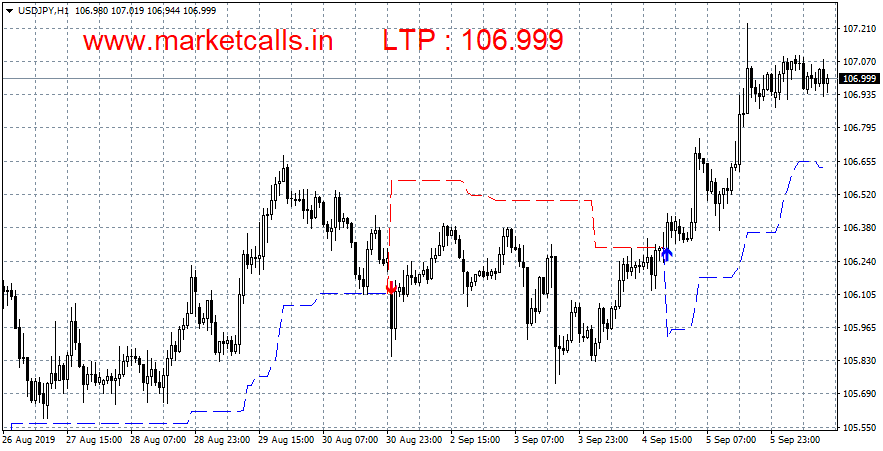
A blue arrow pointing up is a buy signal, while a red arrow pointing down is a sell signal. Additionally, the indicator acts as a support or as resistance and it can be used as a trailing stop loss for the existing trade.
Non-Repainting Supertrend Indicator Free
When the indicator is in a bullish territory any dip towards the indicator line can also be used as a buying opportunity. In opposite, when the indicator is in a bearish territory any price movement towards the indicator line can also be used as a selling opportunity.
A conservative trader can use the indicator in the following way. A blue arrow and when the indicator in the higher timeframe is in a bullish territory is a buy signal. A red arrow and when the indicator in the higher timeframe is in a bearish territory is a sell signal.


