


Key Takeaways
Trading patterns in focus as market swings between favoring mega caps and smaller firms
Crude oil continues falling and trades near five-month lows on China demand worries
Focus narrows as Friday’s
jobs report looms and investors eye ADP employment data
(Wednesday market open) As the countdown continues toward Friday’s jobs report, underlying trading patterns oscillated between favoring the mega caps that led this year’s rally and sectors that lagged most of the year.
Tuesday’s market action saw money flow back to some of the top-performing sectors of 2023, including technology, consumer discretionary, and communication services. That was the opposite of the trading pattern the previous few days in which beaten-down small caps gained traction. A trend back toward mega caps could hurt market breadth by underpinning a handful of the largest stocks while the rest of the market treads water or declines.
“The subsurface pattern is more interesting than anything else, given breadth was so poor yesterday,” said Kevin Gordon, senior investment strategist at Schwab. “Friday is the dominant focus.”
When mega caps outpaced the rest of the market in early 2023, it partly reflected investors perceiving them as a possible safe haven amid geopolitical and banking industry concerns. Now, worries about a global slowdown appear to play into this type of trading. Interestingly, new 52-week highs still outpaced 52-week lows by a large amount yesterday at the New York Stock Exchange (NYSE).
Mega caps gained again in premarket trading Wednesday, helping boost the overall market. Treasury yields remained near recent lows with the 10-year note yield under 4.2%, while crude oil trades near five-month lows. The combination of weaker yields and oil might provide a tailwind on Wall Street, but major indexes appeared reluctant to test technical resistance levels late last week, especially the long-term 4,600 mark for the S&P 500® index (SPX).
As Gordon noted, the main focus today and tomorrow remains Friday’s Nonfarm Payrolls report and what it might tell investors about the pace of job creation and employment in November. Analysts expect job growth of around 180,000, according to Trading Economics. See more below. Today’s ADP National Employment report for November showed a rise of 103,000, well below the 127,000 consensus from Briefing.com. However, the ADP report hasn’t correlated closely with the government’s payrolls report in recent months.
Morning rush
- The 10-year U.S. Treasury Yield (TNX) inched up one basis point to 4.18%.The U.S. Dollar Index ($DXY) climbed to 104.03, back above its 200-day moving average. Cboe Volatility Index® is near recent lows at 12.85.WTI Crude Oil (/CL) fell 0.8% to $71.72 per barrel.
Oil prices fell again in premarket trading as U.S. supplies grew. Worries about a possible worsening demand outlook in China also weigh on the energy market.
What to watch
On the way to Friday’s Nonfarm Payrolls report, investors found a few interesting nuggets this week. The payrolls report follows Tuesday’s October Job Openings and Labor Turnover Survey (JOLTS), which showed the lowest growth in job openings since April 2021.
“The JOLTS figure is signaling what the recent rise in continuing claims is conveying, that those who have recently been laid off are having a relatively harder time finding a new job,” said Nathan Peterson, director of derivatives analysis at the Schwab Center for Financial Research.
Speaking of jobless claims, the weekly update is due tomorrow morning and analysts see it jumping to 223,000 from 218,000 last time, Briefing.com says. However, continuing claims arguably deserve more of your attention, due in part to what Schwab’s Peterson said about jobs getting harder to find. The four-week average of continuing claims rose to 1.866 million in the last report, the highest level since December 2021.
Looking back, ISM Services PMI® for November turned out slightly better than expectations yesterday and may have played a part in propping up Treasury yields following early weakness. On a positive note, the prices index dipped even as employment and business activity ticked up, a combination that could point toward the “soft landing” scenario that Wall Street’s bulls desire. If growth can come without inflation, the thinking goes, investors won’t have to keep trading as if “good is bad.”
Interestingly, today’s November ADP report showed leisure and hospitality jobs declining for the first time in quite a while after being a major contributor for several months.
“Restaurants and hotels were the biggest job creators during the post-pandemic recovery,” ADP said. “But that boost is behind us, and the return to trend in leisure and hospitality suggests the economy as a whole will see more moderate hiring and wage growth in 2024.”
ADP wasn’t the only data this morning. The U.S. government revised Q3 nonfarm productivity higher to 5.2%, the largest increase since Q3 2020, and unit labor costs were revised to a sharp 1.2% drop, the biggest decline since Q4 2022. This combination of stronger productivity and falling labor costs could add support to the “soft landing” theory.
Stocks in spotlight
The earnings calendar is about to get packed, or at least crowded for this time of year. Thursday brings reports from Dollar General (DG), Lululemon (LULU), and Broadcom (AVGO).
Not to overlook Dollar General and Lululemon, but investors have mulled plenty of retail earnings over the last month. Guidance could have an impact, but retail stocks are so varied that it’s hard to take any single retailer and apply their specific outlook to the broader sector or market.
While semiconductor firms like Broadcom also differ from each other, the focus on artificial intelligence (AI) that played such a big part driving the market higher this year makes earnings and guidance from chip and cloud firms an important piece of the sentiment puzzle. Almost single-handedly, Salesforce (CRM) lifted the Dow Jones Industrial Average ($DJI) to sharp gains when it reported solid earnings last week.
Broadcom isn’t a $DJI member, but it swings lots of weight with its nearly $375 billion market capitalization. Last time out, a slight beat of Wall Street’s expectations didn’t help shares, possibly reflecting Broadcom’s 4% estimate for Q4 revenue growth. That was in line with analyst expectations but arguably didn’t blow anyone away. Guidance is key again this quarter as investors seek increased evidence that AI is starting to have an impact on Broadcom’s financials. Toll Brothers (TOL) shares popped 2% in premarket trading after the homebuilder’s earnings surpassed Wall Street’s expectations. The company, which is holding its earnings call this morning, said in a press release it expects falling mortgage rates and inflation to help it keep growing in 2024.
Eye on the Fed
Early today, futures trading pegged chances at 97.7% of the Federal Open Market Committee (FOMC) holding its benchmark funds rate steady following its December 12–13 meeting, according to the CME FedWatch Tool. Chances of rates staying on pause following the FOMC’s January 30–31 meeting are 85.9%. The market prices in a 60% chance that rates will be lower than now after the Fed’s March meeting.
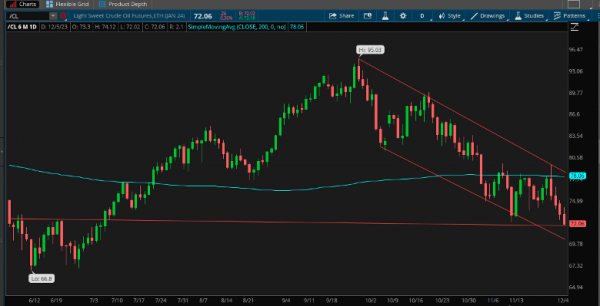
CHART OF THE DAY: CRUDE STILL STUMBLING. WTI crude (/CL-candlesticks) recorded its lowest daily close since early July yesterday and remains in a downtrend from the late-September high above $95 per barrel (diagonal red lines). The recent plunge took it down to near $72, which marks a line that’s served as both support and resistance on the charts the last six months (straight red line). At the same time, technical resistance may be converging near $78 per barrel, which is where the 200-day moving average (blue line) converges with the downward trend line from the peak. Data source: CME GroupChart source: The thinkorswim® platform. For illustrative purposes only. Past performance does not guarantee future results.
Thinking cap
Ideas to mull as you trade or invest
Cut me some slack: For years, investors might have felt like circus acrobats with no protection below. Interest rates stayed near zero for most of a decade, giving the Fed little recourse to meaningfully stimulate the economy in an emergency. When COVID-19 hit, the Fed funds target range was 1.5% to 1.75%, so the ensuing rate cuts back to zero weren’t necessarily a huge difference maker. On another front, crude oil output spent years roughly matching market needs, meaning prices jumped quickly when geopolitical turmoil erupted. That happened in early 2022 when crude rocketed to $130 per barrel after Russia invaded Ukraine. We’re not out of the woods, but there’s arguably more cushion on both key economic vectors today. Interest rates are much closer to the historical average above 5%, meaning there’s leverage to peel back the onion to deal with surprise events. And thanks in part to OPEC’s output cuts, there could be more slack in crude supplies, helping explain why prices didn’t rally long after the crisis in Israel erupted. If more crude is needed, it appears OPEC could open the taps. All this might mean less market and economic volatility, which investors would likely welcome.
Banana peel for GDP? It’s a good day to talk about economic growth because the Atlanta Fed’s GDPNow indicator gets updated later Wednesday. Last time out, the reading was a seasonally adjusted annual rate of 1.2% for Q4 U.S. Gross Domestic Product (GDP) growth based on current economic data, which would represent a dramatic slowdown from 5.2% in Q3. Consensus from Wall Street analysts is even worse, around zero. Increased consumer spending and inventory investment helped drive Q3 growth, the government said. Weakness in the economy for manufactured goods appears to be weighing on Q4 economic growth, with GDPNow adjusted downward last week due to soft construction spending and ISM Manufacturing data released Friday. Yesterday’s ISM Services data suggests that sector remains solid, but the question is how long strong consumer spending on things like Taylor Swift concerts and airline tickets can keep lifting growth, especially if the jobs picture starts to tighten.
Payrolls preview: Friday’s November Nonfarm Payrolls report is expected to show jobs creation of 180,000, according to Trading Economics, but some see the headline number climbing well above 200,000 thanks to the end of several major strikes around the time the data were collected. Also consider monitoring any revisions the government makes to prior reports after it sliced previous estimates the last time out. This sort of slicing and dicing has been a pattern much of the year. Wages are another aspect of the report that could help move markets, and analysts expect 0.2% monthly growth in that category. Unemployment is expected to remain at 3.9%, according to Briefing.com. As always, investors will also watch the sector breakdown to see where job growth was firmest. Manufacturing jobs fell sharply in October, but with the settlement of the auto strike we might see that category come roaring back.
Calendar
Dec. 7: October wholesale inventories and expected earnings from Broadcom (AVGO), Lululemon (LULU), and Dollar General (DG).
Dec. 8: November Nonfarm Payrolls, preliminary University of Michigan December Consumer Sentiment.
Dec. 11: Oracle (ORCL) earnings.
Dec. 12: November Consumer Price Index (CPI) and core CPI.
Dec. 13: FOMC rate decision, November Producer Price Index (PPI).
The Schwab Center for Financial Research is a division of Charles Schwab & Co., Inc.
Charles Schwab & Co., Inc. (“Schwab”) and TD Ameritrade, Inc., members SIPC are separate but affiliated subsidiaries of The Charles Schwab Corporation. TD Ameritrade is a trademark jointly owned by TD Ameritrade IP Company, Inc. and The Toronto-Dominion Bank.


