


Key Takeaways
Market awaits first of week’s labor market data as JOLTS looms after open
Rotation into smaller-caps continued to begin week as large tech shares drew back
Services PMI data looms later, along with earnings from home builder Toll Brothers
(Tuesday market open) Major stock indexes extended losses in premarket trading Tuesday as traders eyed debt news out of China and awaited U.S. job openings data.
Moody’s lowered its outlook on China to negative from stable as debt levels across the country continue to rise. Markets fell across Asia overnight and flattened in Europe following yesterday’s downturn in U.S. stocks after a five-week win streak. The Moody’s news could have an impact for investors who own emerging market bonds because China has made up a growing share of that market.
Monday saw the recent pattern persist in which smaller stocks outpaced their larger brethren. Notably, the Russell 2000® Index (RUT) of small-cap shares posted solid gains Monday even as the Nasdaq Composite ® ($COMP) and the S&P 500® index (SPX) finished lower amid weakness in “mega-cap” stocks
“This speaks to the sector rotation that’s now in its third week,” said Joe Mazzola, director of trader education at Schwab. “There’s been a strong rotation into small caps, and the Russell 2000 is finally above its 200-day moving average after a big spike in volume last Friday. There’s been an expansion in market breadth. The SPX fell Monday because the mega caps were down, but there’s healthy breadth under the surface.”
Technology and communications services shares were among the weakest performers Monday, with the Philadelphia Semiconductor Index (SOX) dropping 1.2%, its lowest level since mid-November.
Morning rush
- The 10-year U.S. Treasury Yield (TNX) fell nearly six basis points to 4.22%.The U.S. Dollar Index ($DXY) rose slightly to 103.81.Cboe Volatility Index® was stable at 13.3, just off recent lows.WTI Crude Oil (/CL) traded unchanged at $73.04 per barrel, near last month’s lows.
What to watch
This week’s job numbers—starting with today’s October Job Openings and Labor Turnover Survey (JOLTS) and culminating with Friday’s November Nonfarm Payrolls report—follow a recent string of relatively subdued inflation readings that appear to have the market convinced the Fed won’t need to boost rates again. Investors increasingly lean toward the view that the Fed’s next rate move will be a cut during the first half of 2024, though Fed Chairman Jerome Powell didn’t specifically back that idea in recent remarks when he said the Federal Open Market Committee (FOMC) hasn’t discussed rate cuts.
Also, any stronger-than-expected jobs figures could send bond yields higher and force investors to quickly recalibrate their Fed expectations. Treasury yields bounced back Monday from Friday’s nearly three-month lows.
Your daily data dose: Today’s October JOLTS data is due at 10 a.m. ET. Job openings remained stubbornly high in recent months, but other labor market metrics slowed, so the question is whether any slowdown showed up in October’s JOLTS data.
Analysts see JOLTS at 9.3 million in October, down from 9.553 million in September, according to analyst estimates from Trading Economics. Still even 9 million is about 50% above pre-pandemic levels. Check the report’s “quit” rate, which can indicate if workers feel comfortable leaving jobs to find new ones.
The other standout report today is ISM Services PMI® for November, which tracks services sector health. Analysts expect services to remain in expansion after being fueled most of the year by firm demand for travel, tickets, restaurants, casinos, and other “fun” pursuits. Consensus is 52.4%, according to Briefing.com, up from 51.8% in October.
“Services PMI is an important economic indicator,” Schwab’s Mazzola said. “Services has been holding court with weakness in manufacturing and housing, so if services roll over without those improving, that could be an issue. That makes this report potentially market moving.”
Friday’s November jobs report certainly fits the description of potentially market moving. Analysts expect jobs creation of 185,000, a number that’s crept up in recent days, according to Trading Economics. We’ll take a closer look tomorrow and Thursday at some trends to check when the jobs report moves.
Japan data with U.S. implications: Japan’s core consumer inflation rate grew at its lowest level since July 2022 in November, coming in at 2.3%. Inflation there is under a microscope amid speculation that the Bank of Japan might tighten monetary policy. The concern for U.S investors is that higher rates in Japan might weaken U.S. Treasuries as investors buy Japanese debt, resulting in fresh yield pressure on U.S. stocks.
Stocks in spotlight
The earnings calendar becomes fairly active this week. Thursday’s a particularly busy day as earnings loom from Dollar General (DG), Lululemon (LULU), and Broadcom (AVGO).
Before that, investors hear from home builder Toll Brothers (TOL) following today’s close. Like most of the home building sector, shares of Toll Brothers have had a banner year, up more than 76%. Generally, home builder stocks across the spectrum got boosted this year by lower supplies of existing homes driving up demand for new homes. One important metric to watch is order levels, which can indicate demand trends. Margins are also worth tracking to see if rising materials costs had a negative impact because the price of lumber is up more than 8% year-to-date.
Eye on the Fed
Early today, futures trading pegged chances at 99.9% of the Federal Open Market Committee (FOMC) holding its benchmark funds rate steady following its December 12–13 meeting, according to the CME FedWatch Tool. Chances of rates staying on pause following the FOMC’s January 30–31 meeting are 85.5%. The market prices in a 62% chance that rates will be lower than now after the Fed’s March meeting.
Talking technicals: A key resistance point on the charts remains 4,600 for the SPX, and it once again retreated Monday after coming within a whisker of that mark on Friday. Key support is at 4,500. Technical breadth improved last week, with 85% of SPX stocks recently trading above their 50-day moving averages and 62% above their 200-day. The RUT small-cap index broke above its 200-day moving average and is now up 12% over the last month.
Inflation primer: There’s no shortage of data on inflation, but it’s easy to lose yourself in the numbers without fully grasping the nuances. In his latest posting, Schwab’s Senior Investment Strategist Kevin Gordon helps investors understand recent trends, how to break them down, and how you can best track the data from here.
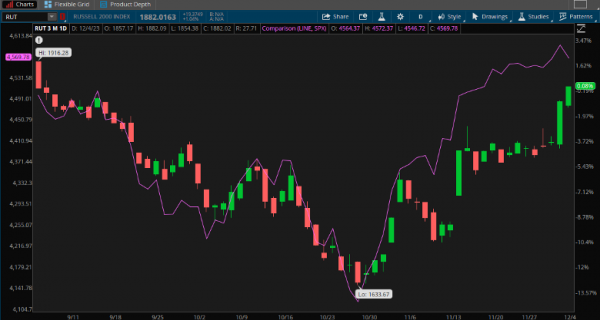
CHART OF THE DAY: COMEBACK KID? The S&P 500 index (SPX-purple line) recently posted its highest close of 2023, but it lost ground Monday. The Russell 2000 (RUT-candlesticks) small-cap index remains below its 2023 highs but showed a bit more zip the last week and is up 12% over the last month as hopes of lower rates appear to drive some investors back toward smaller stocks. Data sources: FTSE Russell, S&P Dow Jones Indices. Chart source: The thinkorswim® platform. For illustrative purposes only. Past performance does not guarantee future results.
Thinking cap
Ideas to mull as you trade or invest
Breadth check: Info tech and communications services stocks, which include most of the mega caps, stayed in the doghouse Monday after coming under pressure last week. This could indicate consolidation after the rally in shares of stocks like Apple (AAPL) and Microsoft (MSFT) helped lead the broader market to double-digit gains in November. Technical resistance in the Nasdaq Composite ($COMP) near the July high of 14,350 appeared to be another possible factor in the recent tech market slump. The current softness in mega-cap tech and communication services stocks may hinder Wall Street’s rally in the broad indexes, but it could have positive ramifications if the rest of the market gets back on its feet without so much help from a handful of lofty names. That’s what seemed to be happening to some extent last week as sectors like industrials and financials helped lead gains and small caps found bidders as well. Even on Monday, the small-cap RUT showed signs of vigor while larger-cap indexes stayed under a cloud. One way to monitor market breadth is to watch the percentage of stocks trading above their 50-day moving averages. As of Monday, around 85% of S&P 500 stocks traded above their 50-day moving average, still a moderate level this far into a rally from the October 2022 bear market low and a sign breath remains slightly narrow.
Merry-go-round: The perceived rotation into value and underperforming sectors appeared to start around the middle of last week, said Nathan Peterson, director of derivatives analysis at the Schwab Center for Financial Research. He said some investors might be rolling into these types of stocks thinking that if the Fed is done raising rates, perhaps underperforming small caps deserve more of a chance as “catch-up” trades. These stocks tend to be more interest rate-sensitive and got steamrolled by the Fed’s dramatic tightening over the last year. Dividend stocks and dividend-oriented sectors like utilities and staples also slumped in the face of high rates, but their yields sometimes compete better with Treasuries when interest rates start to fall. It’s unclear if this potential sector rotation is the start of a trend, but if it gains traction, it might remind investors to stay diversified, not only across asset classes but also across sectors.
Central casting: Next week’s Fed meeting shares the spotlight with a European Central Bank (ECB) gathering. Last week’s rate-friendly European inflation data and continued manufacturing sector weakness doesn’t mean an ECB rate cut next week, but next year is another story. “Weak economic data and lower inflation have emboldened traders to price in five rate cuts in 2024 by the ECB,” said Michelle Gibley, director of international research at the Schwab Center for Financial Research. Optimism about possible ECB cuts could help explain how the dollar’s slide got arrested last week from recent three-month lows. A weaker dollar tends to help large-cap U.S. stocks, so the slight comeback could be one factor blocking Wall Street’s rally. The ECB’s decision comes December 14, but several central banks meet before then. “No change to policy is expected at the Australia, Canada or India central bank meetings, but investors will be paying attention to any revisions to economic forecasts and commentary about the potential for rate cuts in 2024,” Gibley added. “Of this week’s meetings of central banks, Canada is expected to shift to cuts first, as soon as April.
Calendar
Dec. 6: Expected earnings from GameStop (GME), Chewy (CHWY), and Campbell Soup (CPB).
Dec. 7: October wholesale inventories and expected earnings from Broadcom (AVGO), Lululemon (LULU), and Dollar General (DG).
Dec. 8: November Nonfarm Payrolls, preliminary University of Michigan December Consumer Sentiment.
Dec. 11: No major earnings or data expected.
Dec. 12: November Consumer Price Index (CPI) and core CPI.
The Schwab Center for Financial Research is a division of Charles Schwab & Co., Inc.
Charles Schwab & Co., Inc. (“Schwab”) and TD Ameritrade, Inc., members SIPC are separate but affiliated subsidiaries of The Charles Schwab Corporation. TD Ameritrade is a trademark jointly owned by TD Ameritrade IP Company, Inc. and The Toronto-Dominion Bank.


